

You are here
Math ASAS Model Lesson
At CDE's Summer 2016 All Standards, All Students Institute, part of DSCP Phase IV work in mathematics, I delivered this lesson to a group of about 20 elementary, middle school, and high school mathematics teachers. Because of the wide grade range represented in the room, I chose a task that could be used with students from upper elementary through 12th grade. - Raymond Johnson, Mathematics Content Specialist
The Task: Track Stars (Schwartz & Martin, 2004)
Bill and Joe are both on the U.S. Track Team. They also both broke world records last year. Bill broke the world record for the high jump with a jump of 8 ft. Joe broke the world record for the long jump with a jump of 26 ft, 6 in. Now Bill and Joe are having an argument. Each of them think that his record is the best one. You need to help them decide. Based on the data in the table, decide if 8 ft shattered the high jump record more than 26 ft 6 in. shattered the long jump record.
| Top High Jumps in 2000 | Top Long Jumps in 2000 | ||
|---|---|---|---|
| Height | Number of Jumps | Length | Number of Jumps |
| 6'6" | 1 | 21'6" | 1 |
| 6'8" | 2 | 22'0" | 2 |
| 6'10" | 3 | 22'6" | 2 |
| 7'0" | 5 | 23'0" | 9 |
| 7'2" | 6 | 23'5" | 9 |
| 7'4" | 7 | 24'6" | 4 |
| 7'6" | 4 | 25'0" | 1 |
| 7'8" | 1 | 25'6" | 1 |
| 8'0" | 26'6" | ||
When I used this task in the CU Boulder + DPS + UCAR Inquiry Hub research project, high school algebra teachers rated it highly: 5 out of 6 teachers said it rated as "Doing Mathematics" in Smith and Stein's (1998) cognitive demand framework and the task was unanimously judged as a good example of a task likely to engage students in Standard for Mathematical Practice #3, construct viable arguments and critique the reasoning of others.
Context
For the summer workshop I was working with about 20 math teachers who would be grouped by grade band (elementary, middle high) and I asked them to attempt the task using the abilities expected of students at their grade level. I admit, this makes for a somewhat artificial exercise, but I wanted to see if this task would stretch across a lot of different levels of student ability and elicit a very wide range of student strategies (even if the "students" were teachers).
One of my greatest teaching weaknesses has always been in my questioning strategies. Too often I accept quick choral responses to questions in the initiate-respond-evaluate pattern, and I don't do much to (a) push student thinking and (b) promote equitable participation, so for this lesson I used a combination of these resources:
- As a planning guide I used Smith and Stein's 5 Practices for Orchestrating Productive Mathematics Discussions.
- I used CMP's Launch, Explore, Summarize as an instructional model.
- My focus practice was facilitate meaningful discourse from Principles to Actions, and I especially wanted to sharpen my pressing and linking talk moves. The Talk Science Primer from TERC is an excellent resource on talk moves.
- I used a form of "student self-check" in the style of practical measures to help me reflect.
There is a lot of overlap in the 5 Practices, Launch/Explore/Summarize, and the goal of facilitating meaningful discourse. That's a good thing.
Lesson Planning and Implementation
I anticipated (the first of 5 Practices) different strategies across the three groups:
- I expected the elementary school group to focus on measuring distances and visual comparisons, and to bring up struggles around working with feet and inches and the under-developed sense of ratio.
- I expected the middle school group to calculate means and use proportional reasoning (like, "The record is 110% of the average), and perhaps use mean absolute deviation (MAD) as a measure of variability. I expected to see struggles in accounting for the multiple jumps at each distance, in calculating MAD, and debates around using mean vs. median as a measure of center.
- I expected the high school group to be similar to the middle school group, but to use standard deviation instead of MAD.
For the launch phase I avoided giving away any hints or clues about possible strategies. It was difficult to design a launch that connected to prior knowledge because of the artificial nature of teachers playing the role of students, so I took a moment to ask the teachers to think about the knowledge they'd expect students to have given the standards at their grade levels.
During the explore phase of the lesson I monitored (the second of 5 Practices the groups for the strategies I anticipated. I wanted to use pressing questions here to push people's thinking, such as:
- "Can you tell me why you think that is correct?"
- "What do you mean by 'farther'? Is it because you added? What else might you do to measure 'farther'?"
Questions like this designed to press for student thinking were often met with teacher speculation about student thinking. As solution strategies came together, I noted them on my phone with the goal of selecting (the third of 5 Practices) two strategies per group to discuss during the whole-group summary phase of the lesson. The sequencing plan (the fourth of 5 Practices) was to discuss elementary first, then middle, then high school, with the less sophisticated strategy presented first at each level.
Here are the two posters from the elementary group:
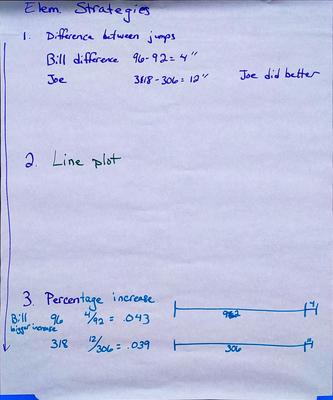
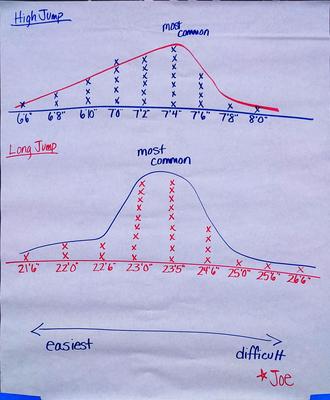
The elementary group could quickly work through multiple strategies, so from this group I got more than just the two strategies I planned for. One set of strategies focused on how much more the record was than the next longest/highest jump, and the other set used a graphical representation of the jumps. Here are the posters from the middle school group:
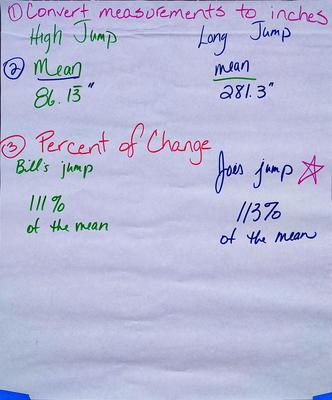
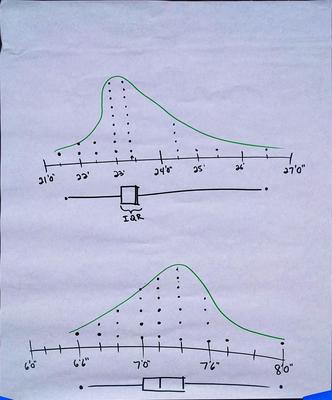
One set of strategies compared the record jumps to the mean jumps, and the other set used a graphical display and interquartile range. Here are the two posters from the high school group:
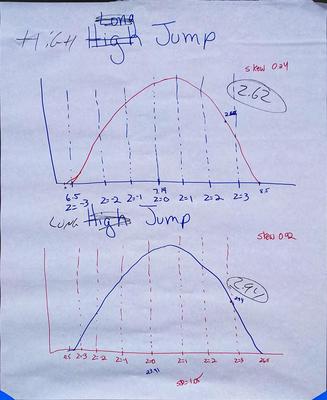
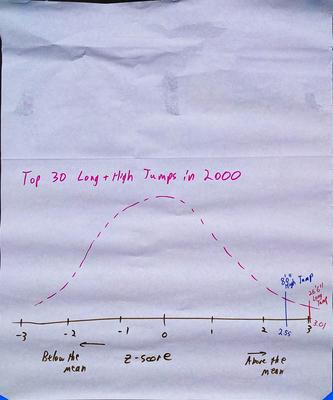
There was less to differentiate these two strategies, as both groups calculated standard deviations and z-scores as a way of measuring how far above the mean was each record jump.
In the summarize phase of the lesson, I focused my questioning around linking moves, such as:
- "How does your strategy compare to the first one from the elementary group?"
- (Following an explanation by Kathryn) "Tammy, do you have any questions for Kathryn?"
- "Phillip, how might your argument change if you used Dan's method?"
With questions like these, I hoped to draw connections (the fifth of 5 Practices) between ideas, such as:
- Connecting the visual centers of graphical displays with the calculated centers of the data
- Connecting MAD and SD
- Connecting the "measuring stick" idea between proportional reasoning at lower levels and the counting of MAD/SD units
Reflection
I had some hits and misses in my anticipation of the strategies I saw. The elementary teachers didn't share my expectation of focusing on measurement and comparing those measurements. Instead, they made some useful comparisons between the record and second-best jumps. I also didn't anticipate the dot plots and fitted curves in the second poster. I know it's easy to underestimate the capabilities of elementary students, but these kinds of graphs were not something I anticipated their teachers producing. The middle school group used proportional reasoning, as I expected, but instead of MAD they used IQR as a reference for judging the two jump records. There was one "student" who quickly worked through some MAD calculations towards the end of the work time, but it was a bit late to fit into my selection strategy. For high school, the work was less differentiated and more advanced than I anticipated. Some of this can be attributed to just labeling the group "high school" rather than "9th grade" or "AP Stats."
I was able to practice my talk moves to some degree, but this artificial scenario was less than ideal. I wish I had a video of the lesson so I could target exactly which questions I asked. In the explore phase of the lesson my questions were generally met with speculation about student strategies, not answers as students might give them. That was great for us all to think through the task together, but it interrupted the flow of responses you'd expect with talk moves in a more typical classroom scenario.
The discussion in the summarize phase was pretty good. Not only did we compare strategies and connect ideas in the way I anticipated, there was a welcome amount of analysis of the task itself and the different layers of ambiguity in how the data was presented. For example, we don't know if the jumps all represent different jumpers, or if the jumps represent jumps in one vs. multiple competitions. We generally agreed that some amount of ambiguity would be good when using this task in a classroom, particularly to hit the "make sense of problems" part of SMP #1.
Math "Self Check"
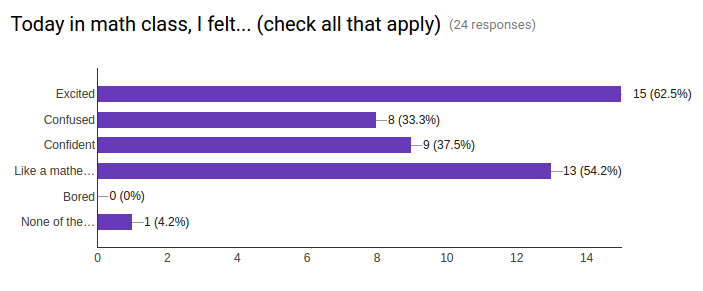
As part of the reflection I collected data in the form of a "self-check," created in the style of "practical measures" that we've used in our research projects. In hindsight, this data doesn't focus much on my choice of teaching practice (facilitating meaningful discourse), but I like the idea of asking students for feedback that go beyond mastery of content. Here are the questions I had "students" (ASAS Institute participants) answer using Google Forms:
1. Today in math class, I felt... (check all that apply):
☐ Excited
☐ Confused
☐ Confident
☐ Like a mathematician
☐ Bored
☐ None of the above
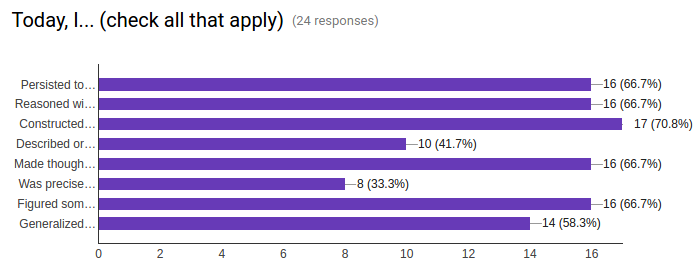
2. Today I... (check all that apply):
☐ Persisted to make sense of a problem and solved it
☐ Reasoned with something complex by using numbers and symbols
☐ Constructed an argument and/or critiqued the reasoning of a classmate
☐ Described or predicted something about the world using math
☐ Made thoughtful choices about tools to help me solve a problem
☐ Was precise in my work and in how I described it to others
☐ Figured something out based on a pattern or structure
☐ Generalized a solution strategy after thinking about multiple examples
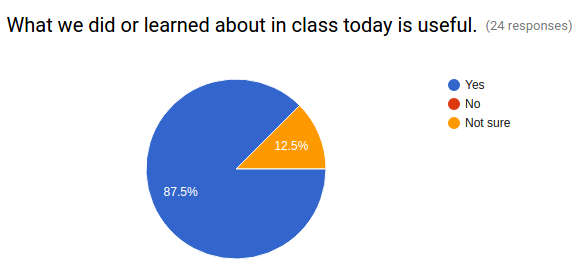
3. What we did or learned about in class today is useful.
- Yes
- No
- Not sure
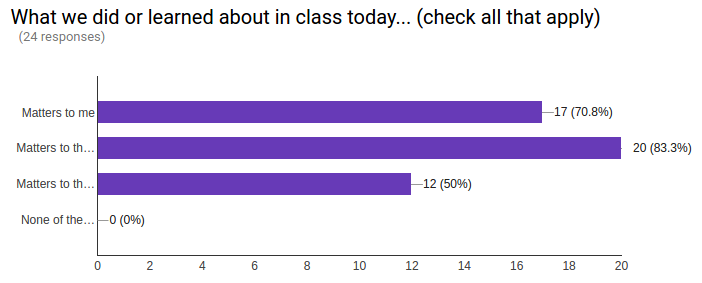
4. What we did or learned about in class today... (check all that apply):
☐ Matters to me
☐ Matters to the class
☐ Matters to the community
☐ None of the above
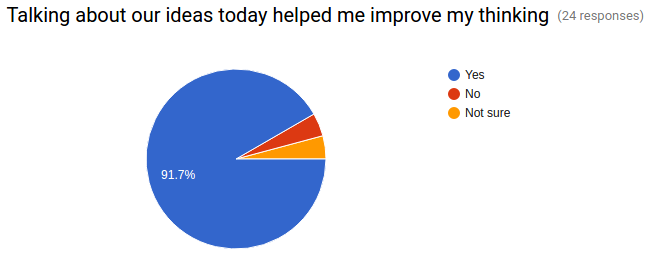
5. Talking about our ideas today helped me improve my thinking.
- Yes
- No
- Not sure
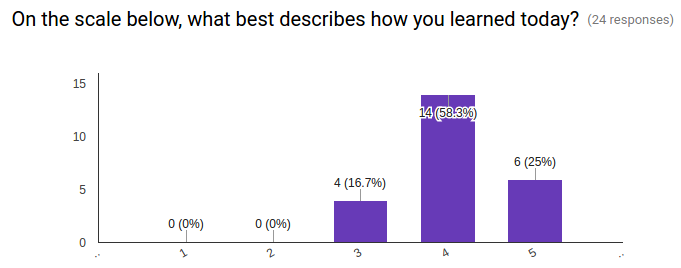
6. On the scale below, what best describes how you learned today?
- 1 The teacher told us everything we needed to learn
- 2
- 3
- 4
- 5 We figured most things out on our own that we needed to learn
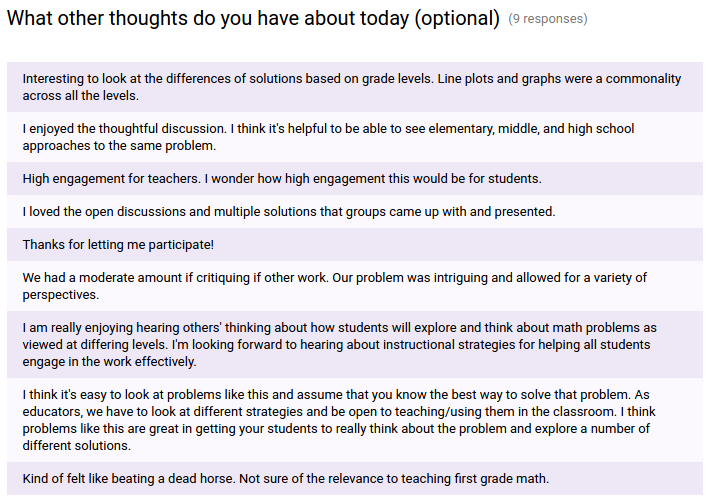
7. What other thoughts do you have about today? (optional)
The responses are a bit difficult to interpret because I'm not sure how many participants responded as teachers versus the students they were sort-of-pretending to be. The results seem mostly positive, and I agree with the very last comment: While the task had reach across many grade levels, first grade was too much of a stretch.
References
Schwartz, D. L., & Martin, T. (2004). Inventing to prepare for future learning: The hidden efficiency of encouraging original student production in statistics instruction. Cognition and Instruction, 22(2), 129–184.
Smith, M. S., & Stein, M. K. (1998). Reflections on practice: Selecting and creating mathematical tasks: From research to practice. Mathematics Teaching in the Middle School, 3(5), 344–350.

Financial information on schools and districts throughout Colorado. Learn more about financial transparency.
Colorado Dept. of Education
201 East Colfax Ave.
Denver, CO 80203
Phone: 303-866-6600
Contact CDE
CDE Hours
Mon to Fri, 8 a.m. to 5 p.m.
See also Licensing Hours
UPDATED
October 4, 2024
Copyright © 1999-2025 Colorado Department of Education.
All rights reserved.
Title IX.
Accessibility.
Disclaimer.
Privacy.

Connect With Us


