You are here
Performance Framework Indicators
Performance Framework Indicators
Achievement
Quick Links
- To explore your school or district’s academic achievement this past year, see the Performance Snapshot.
For the state and district performance frameworks, the achievement indicator reflects the extent to which students have met the learning objectives described in the relevant academic content standards for a given content area and grade level.
What metrics are included in the achievement indicator on the performance frameworks?
The academic achievement indicator reflects average scores (i.e., mean scale scores) on English Language Arts, Math, and Science state assessments in tested grades.
On this indicator, schools and districts earn one of four ratings (Exceeds Expectations, Meets Expectations, Approaching Expectations, or Does Not Meet Expectations) based on the percent of points earned on the above metrics.
How does the achievement performance indicator impact overall ratings on performance frameworks?
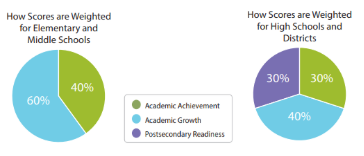
For state accountability purposes, achievement is one of three performance indicators used for determining accreditation and school plan type ratings. For elementary schools and middle schools, achievement results account for 40% of their final ratings. For high schools and districts, 30% of their final ratings are based on achievement.
Growth
Quick Links
- Learn more about cohort and baseline growth here.
- To explore your school or district’s academic growth this past year, see the Performance Snapshot.
For the past decade, Colorado has been a national leader in how to measure a student's academic growth from year to year. About ten years ago, the state created the Colorado Growth Model to look specifically at how individual students progress from year to year based on the state standards. Growth provides another dimension of performance beyond just achievement on tests by describing the relative growth of individual students from year to year. The Colorado Growth Model provides information for many different student populations and identifies areas of strength and areas that may need more support. It also supplies necessary growth data for the annual school and district accountability ratings.
What metrics are included in the growth indicator on the performance frameworks?
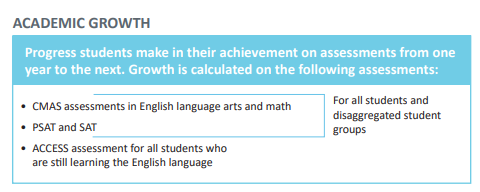
The academic growth indicator reflects median growth percentiles (MGPs) in English Language Arts and Math on state assessments, and MGPs in English Language Proficiency (ELP) for English Language Learners.
On this indicator, schools and districts earn one of four ratings (Exceeds Expectations, Meets Expectations, Approaching Expectations, or Does Not Meet Expectations) based on the percent of points earned on the above metrics.
How does the growth performance indicator impact overall ratings on the performance frameworks?
For state accountability purposes, growth is the most heavily weighted of three performance indicators used for determining accreditation and school plan type ratings. For elementary schools and middle schools, growth results account for 60% of their final ratings. For high schools and districts, 40% of their final ratings are based on growth.
Colorado educational accountability law, requires that a ‘Growth to Standard’ measure be developed for the statewide Math and English Language Arts assessments and included in the district and school performance frameworks. The Technical Advisory Panel for Longitudinal Growth (TAP) has worked to develop this new measure for the Colorado Measures of Academic Success (CMAS) during 2018 and 2019.
The new ‘On Track’ measure will combine elements of both Achievement and Growth methodologies. Achievement results are a point in time snapshot of a student’s cumulative content knowledge and skill, as measured by state assessment scores and performance levels descriptors. Growth measures the change in assessment scores from one year to the next as normatively compared to a student’s Colorado academic peer group. On Track Growth is intended to show whether a student is currently making enough growth to reach a specified achievement target within a defined timeframe.
Post Secondary and Workforce Readiness (PWR)
Quick Links
-
To explore your school or district’s PWR performance this past year, see the Performance Snapshot.
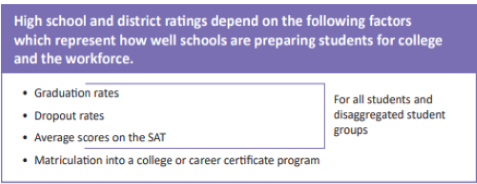
The Postsecondary & Workforce Readiness accountability indicator reflects how well schools are preparing students for college and the workforce.
What metrics are included in the PWR indicator on the performance frameworks?
The PWR metrics include graduation rates, dropout rates, and matriculation rates. This indicator also includes average scores (i.e., mean scale scores) on the SAT college entrance exam for Math and Evidence Based Reading and Writing (EBRW).
On this indicator, schools and districts earn one of four ratings (Exceeds Expectations, Meets Expectations, Approaching Expectations, or Does Not Meet Expectations) based on the percent of points earned on the above metrics.
How does the PWR performance indicator impact overall ratings on the performance frameworks?
For state accountability purposes, PWR is one of three performance indicators used for determining accreditation and school plan type ratings. For elementary schools and middle schools, there are no PWR results. For high schools and districts, 30% of their final ratings are based on PWR performance.
Helpful Links
Contact Us
For more information, please contact accountability@cde.state.co.us.


Connect With Us


