You are here
Summary of 2023-24 Discipline Data Release
Discipline Collection Changes in 2023-24
The method for discipline collection changed in 2023-24 with more detailed reports required. The change in the collection will allow additional analysis and more precise understanding of discipline and behavior. However, with the transition, there may be changes in some data points due to how the data was collected that make comparisons to previous years challenging. Details of this change are outlined below.
- In the 2022 legislative session, House Bill 22 – 1376 was passed that updated the discipline and behavior collection and included additional requirements for district and state level reporting.
- The 2023-24 collection is now collected at the student level with each incident connected to a behavior, a student, and discipline action. Trends for this data are reported at the district and state level and disaggregated by student groups.
Incidents
During the 2023-34 school year, there were 128,205 behavior incidents and disciplinary actions. This is an increase of 11.1% from the previous school year. As is highlighted below, a student could have been involved in multiple incidents so many fewer individual students were involved in a discipline incident in the 2023-24 school year.
Discipline terms:
Incident: Incident refers to a unique event that was reported.
Behavior: For each incident, a behavior is selected from one of 16 state codes.
Discipline Action: For each incident, a discipline action is selected.
Behavior
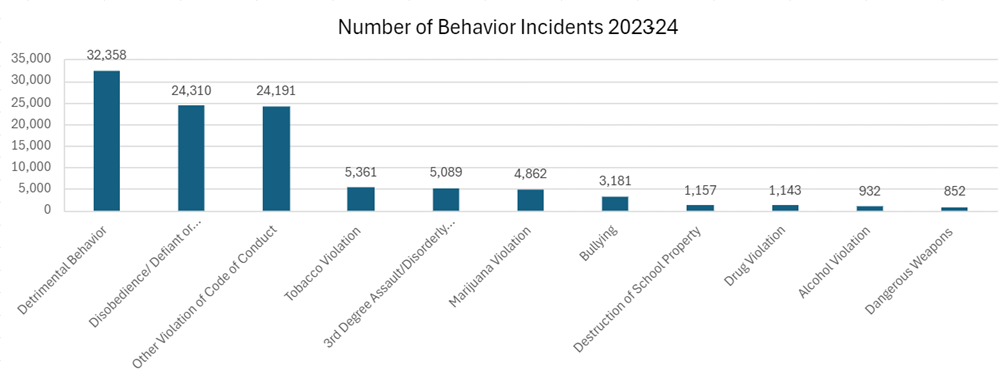
For each incident reported, a student behavior was selected from one of 16 options. There were a total of 103,840 behavior incidents reported during the 2023-2024 school year.
- Descriptions of the state reportable behaviors can be found starting on page 5 of the discipline action file layout.
- The most common behavior incidents that resulted in discipline actions were detrimental behavior, disobedience/defiant or repeated interference, and other code of conduct violations.
- The sum of these three behaviors accounted for 76.4% of the total behavior incidents during the 2023-24 school year.
Discipline Actions
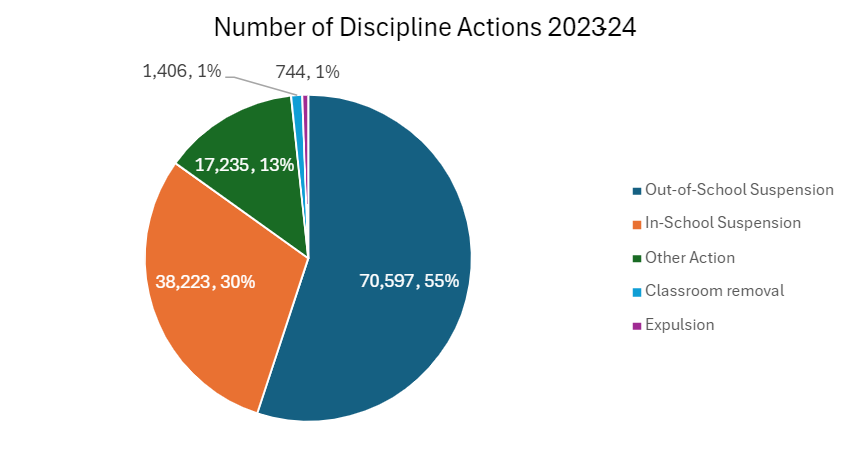
During the 2023-24 school year, there were 128,205 discipline actions reported. For each incident, one or more discipline actions were selected that could include classroom removal, in-school suspension, out-of-school suspension, expulsion, or other discipline action. The intention of the collection is to collect information about discipline actions that removed a student from their regular learning environment.
- The number of in-school and out-of-school suspensions has seen an increase over the past school year from a total of 96,295 suspensions, collectively to 108,820. This equates to 84.9% of the total disciplinary actions during the 2023-24 school year.
- The number of expulsions has reduced from 794 in 2021-22 to 744 in 2023-24.
Note that some changes in the collection, including some of the increases or decreases in the last school year could be due to changes in the way that discipline was collected.
Students
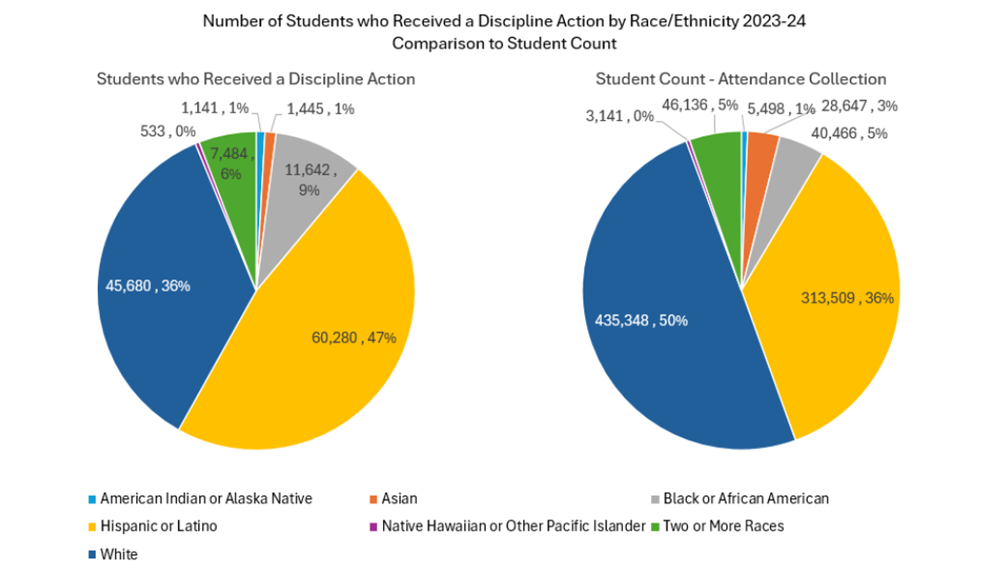
There were 64,791 students who received one or more discipline actions with a total of 128,205 discipline incidents. The number of individual students who received a discipline action was 30% lower from an average of 93,956 during the last two school years. The following comparisons to student population are using the attendance collection K-12 count.
- Male students represent the majority of students in the discipline collection (70% of the students disciplined). This is consistent with the past two years.
- Students receiving special education services represented 24.4% of students within the discipline collection. These student’s represent 13.8% of the overall student population.
- Students who are multilingual learners represented 15.1% of students within the discipline collection. These student’s represent 14.8% of the overall student population.
- About 60% of the students involved in a discipline incident are in 6th, 7th, 8th, or 9th grade.
- Hispanic or Latino students represent the largest racial/ethnic group and almost half (47%) of the students involved in a discipline incident.
Note that students may be counted in multiple categories.
Resources
- CDE’s office of Dropout Prevention and Student Re-engagement supports districts in using evidence-based practices to improve consistency attendance and promising practices from around the state.
- CDE’s Data Services team collects and publishes annual discipline data.


Connect With Us


